Cluster Usage Analytics
Across all the Kubernetes clusters it handles, Krossboard features and displays the following cluster-level analytics:
- Recent Consolidated Usage.
- Usage Trends & History.
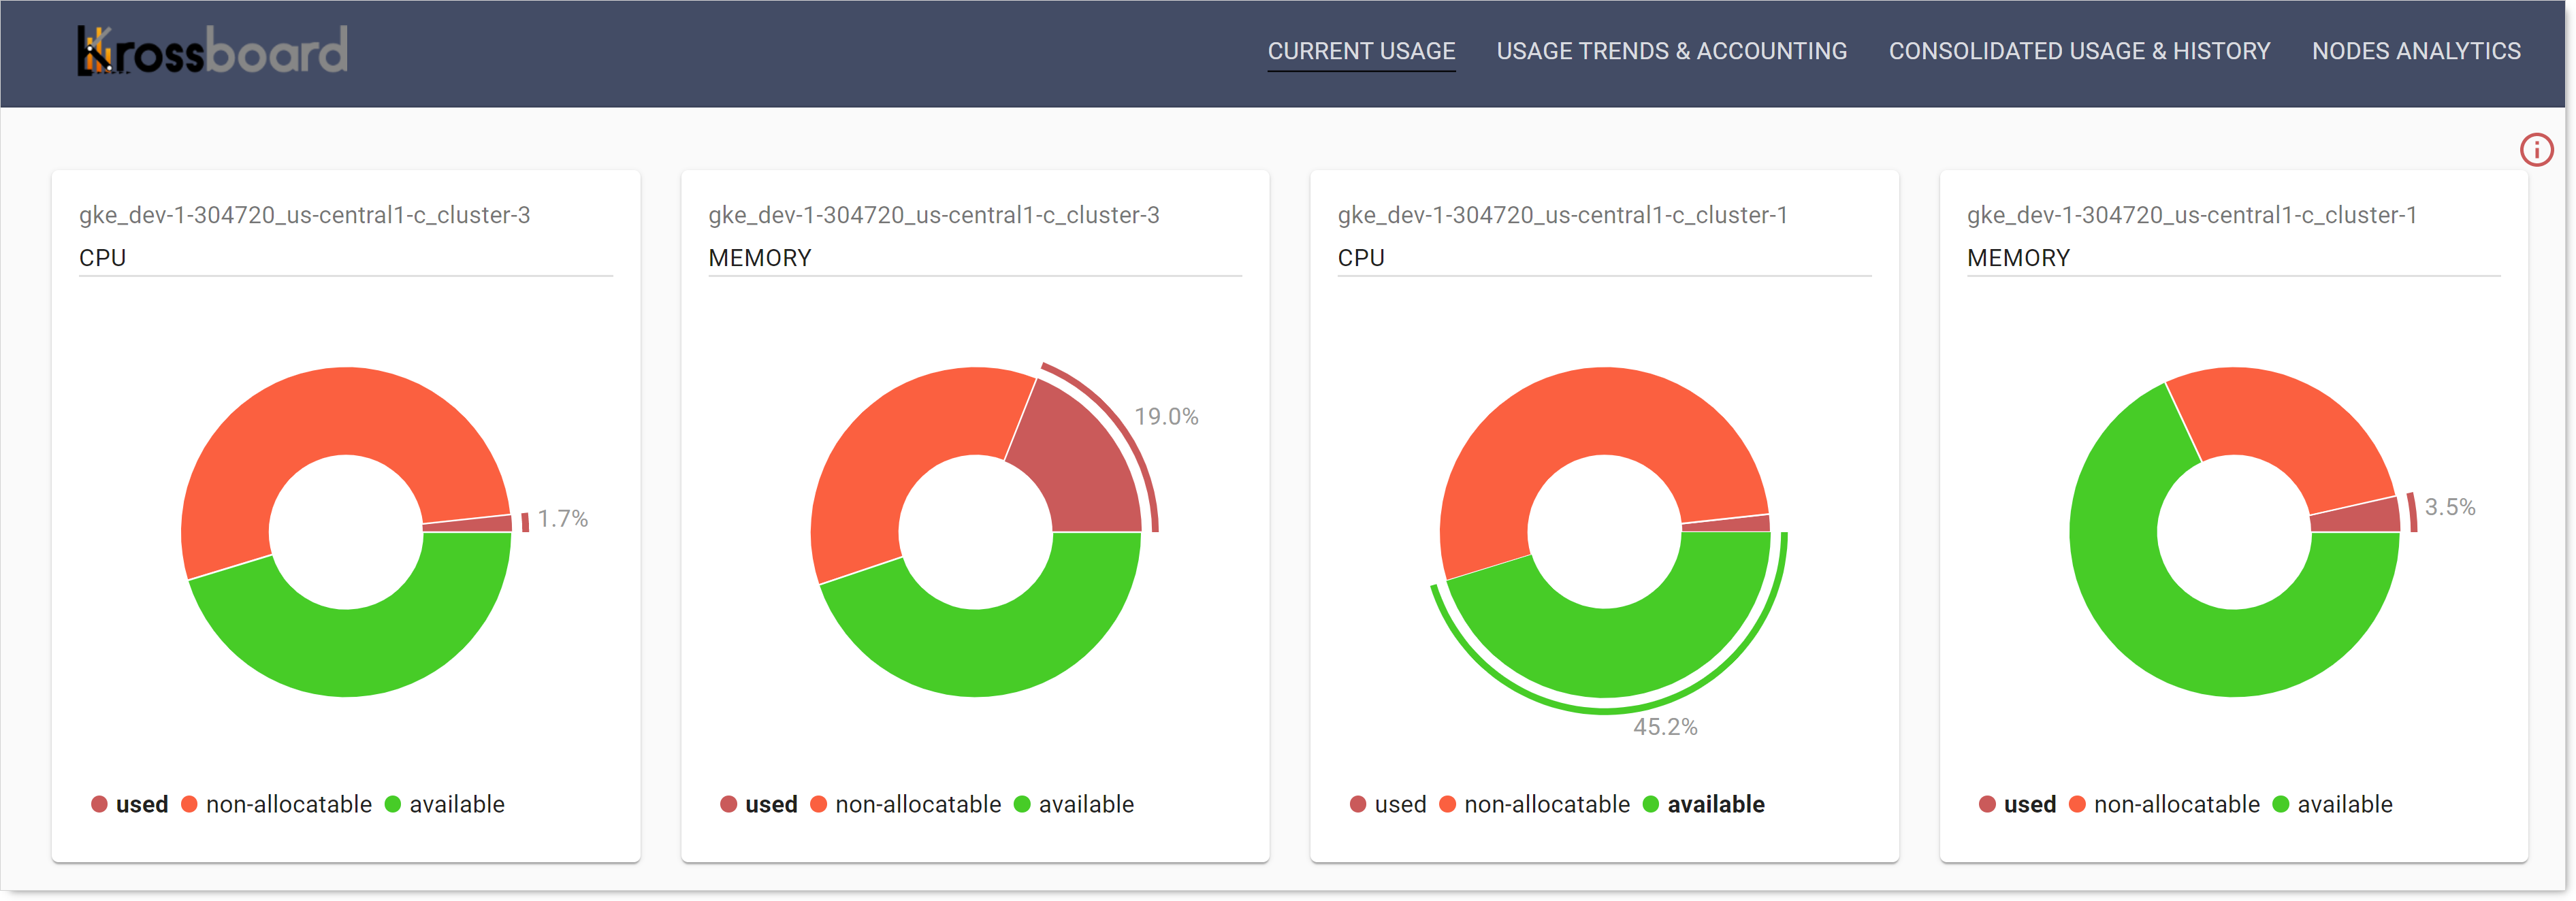
Recent Consolidated Usage
This section displays for each cluster a pie chart showing the latest consolidated CPU and memory usage. Updated every 5 minutes, the provided analytics highlight shares of used, available, and non-allocatable resources.
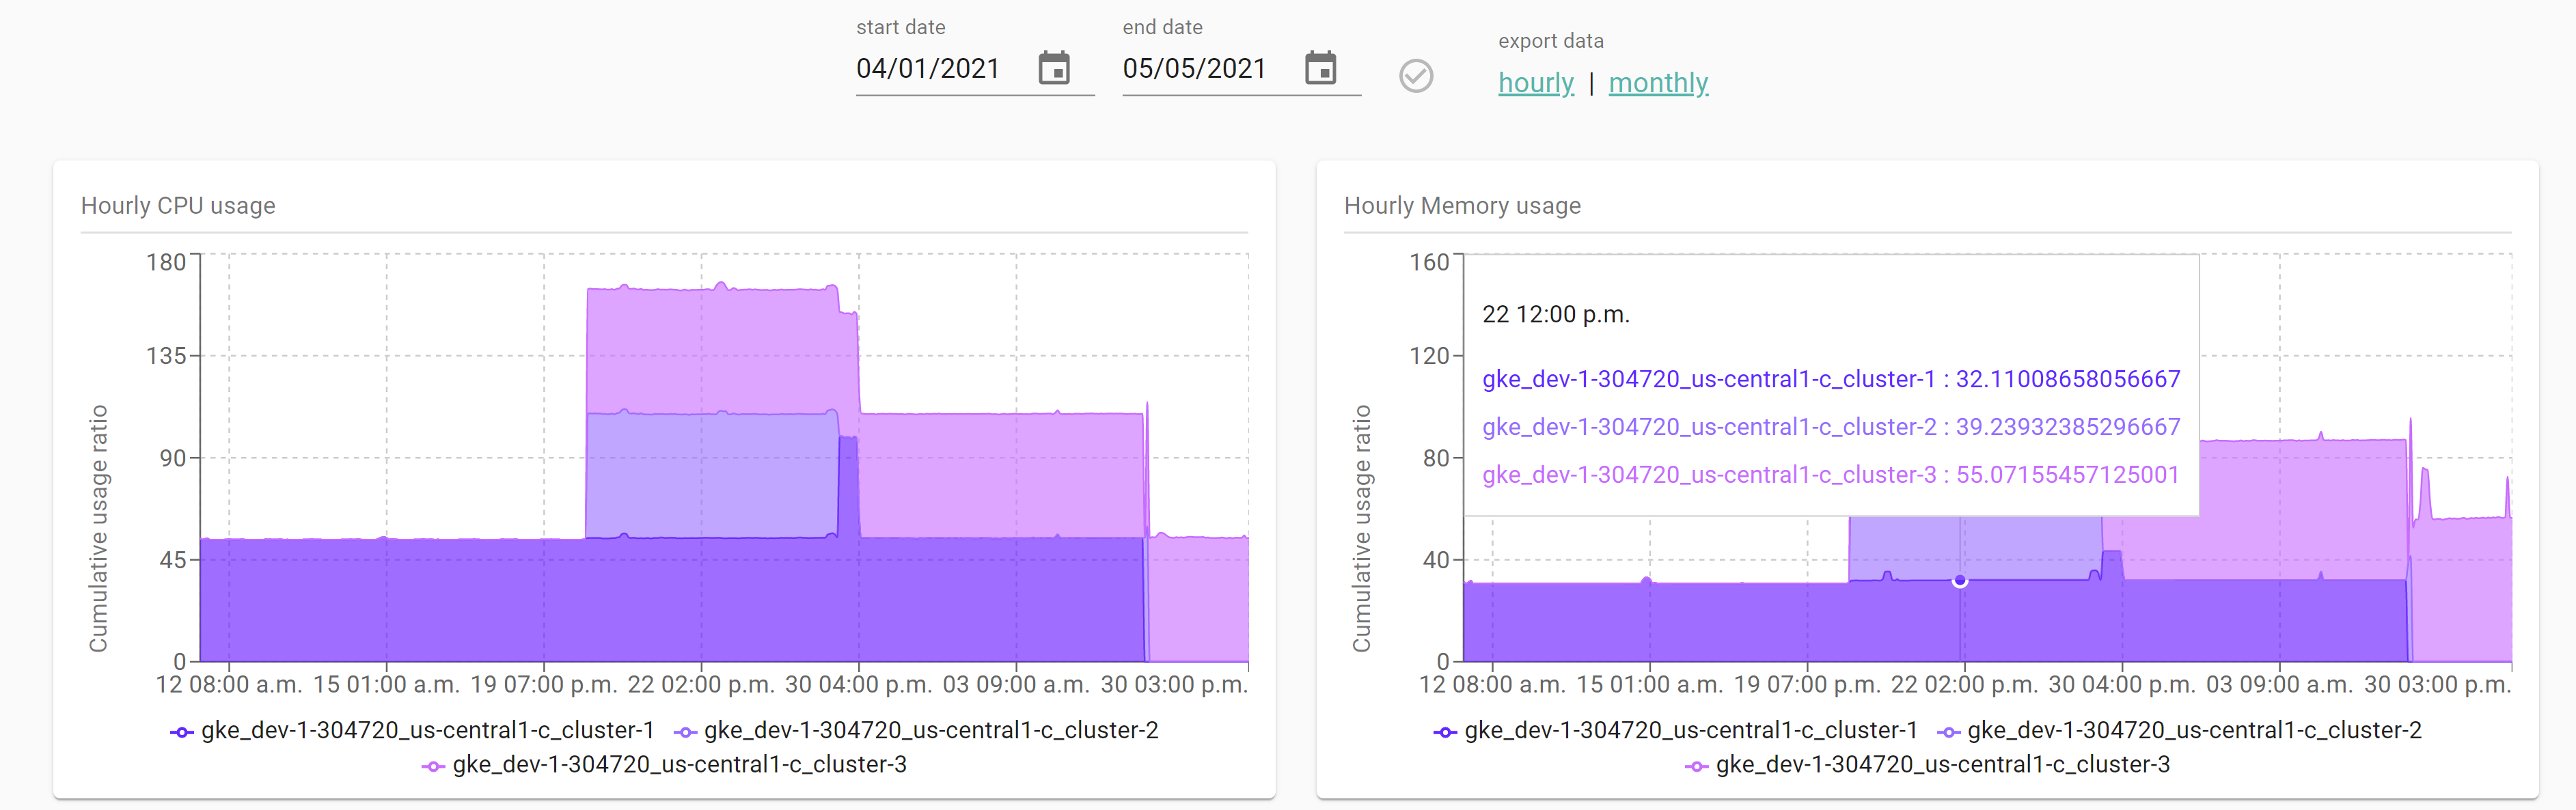
Usage Trends & History
This section is built to provide an at-a-glance visualization to observe and compare the usage of one or more Kubernetes clusters over time or given a specific period. The dashboard feature a comprehensive usage report that includes the usage of the different clusters.
The user can set a period to filter the resulting graphs given a start and an end date.
To export the backing data in CSV, click the export link next to the selected period.
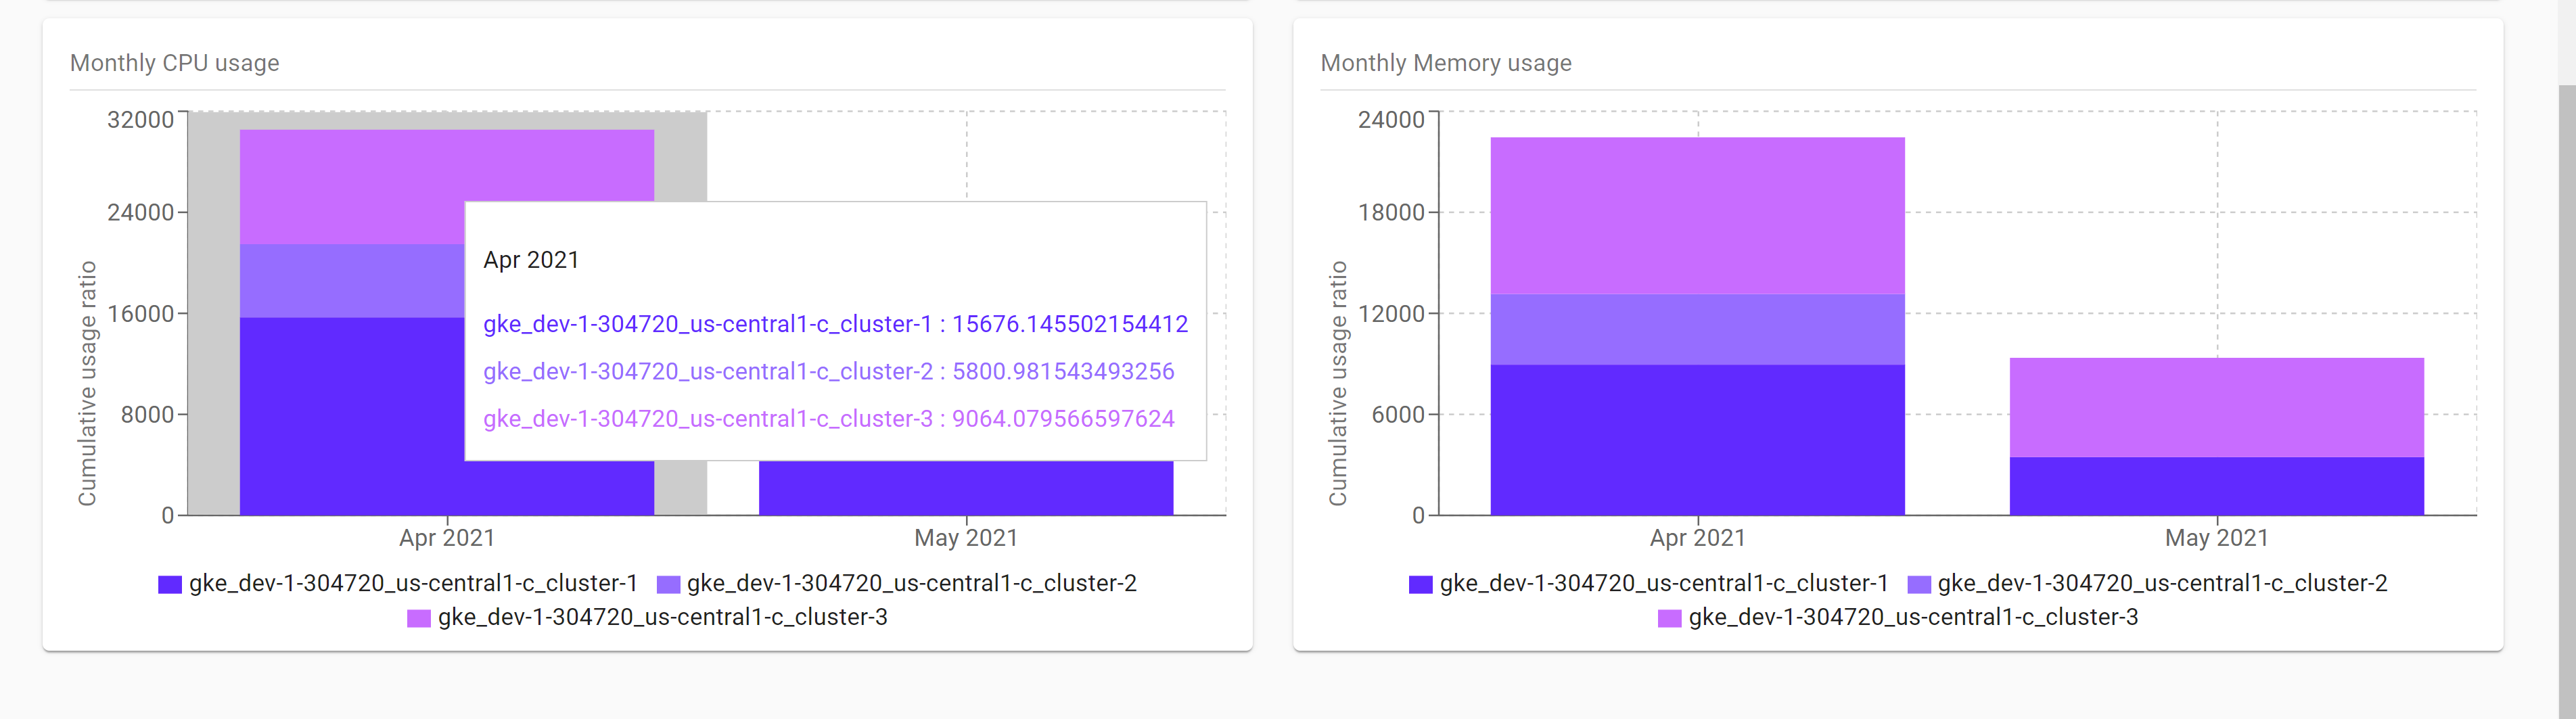
Usage Accounting
For the different clusters handled, this section displays the usage accounting per month. This accounting shown as stacked bar charts does the time frame set by the date filter and may cover up to the last 12 months (i.e. a year of usage).
To export the backing data in CSV, you just have to click on the links next to the cluster list.