Node Usage Analytics
For the different Kubernetes clusters tracked, this page provides node usage analytics with the following perspectives:
- Recent nodes occupation by pods.
- Node usage history by user-defined period of times.
Please note that the activation of these features requires a valid license.
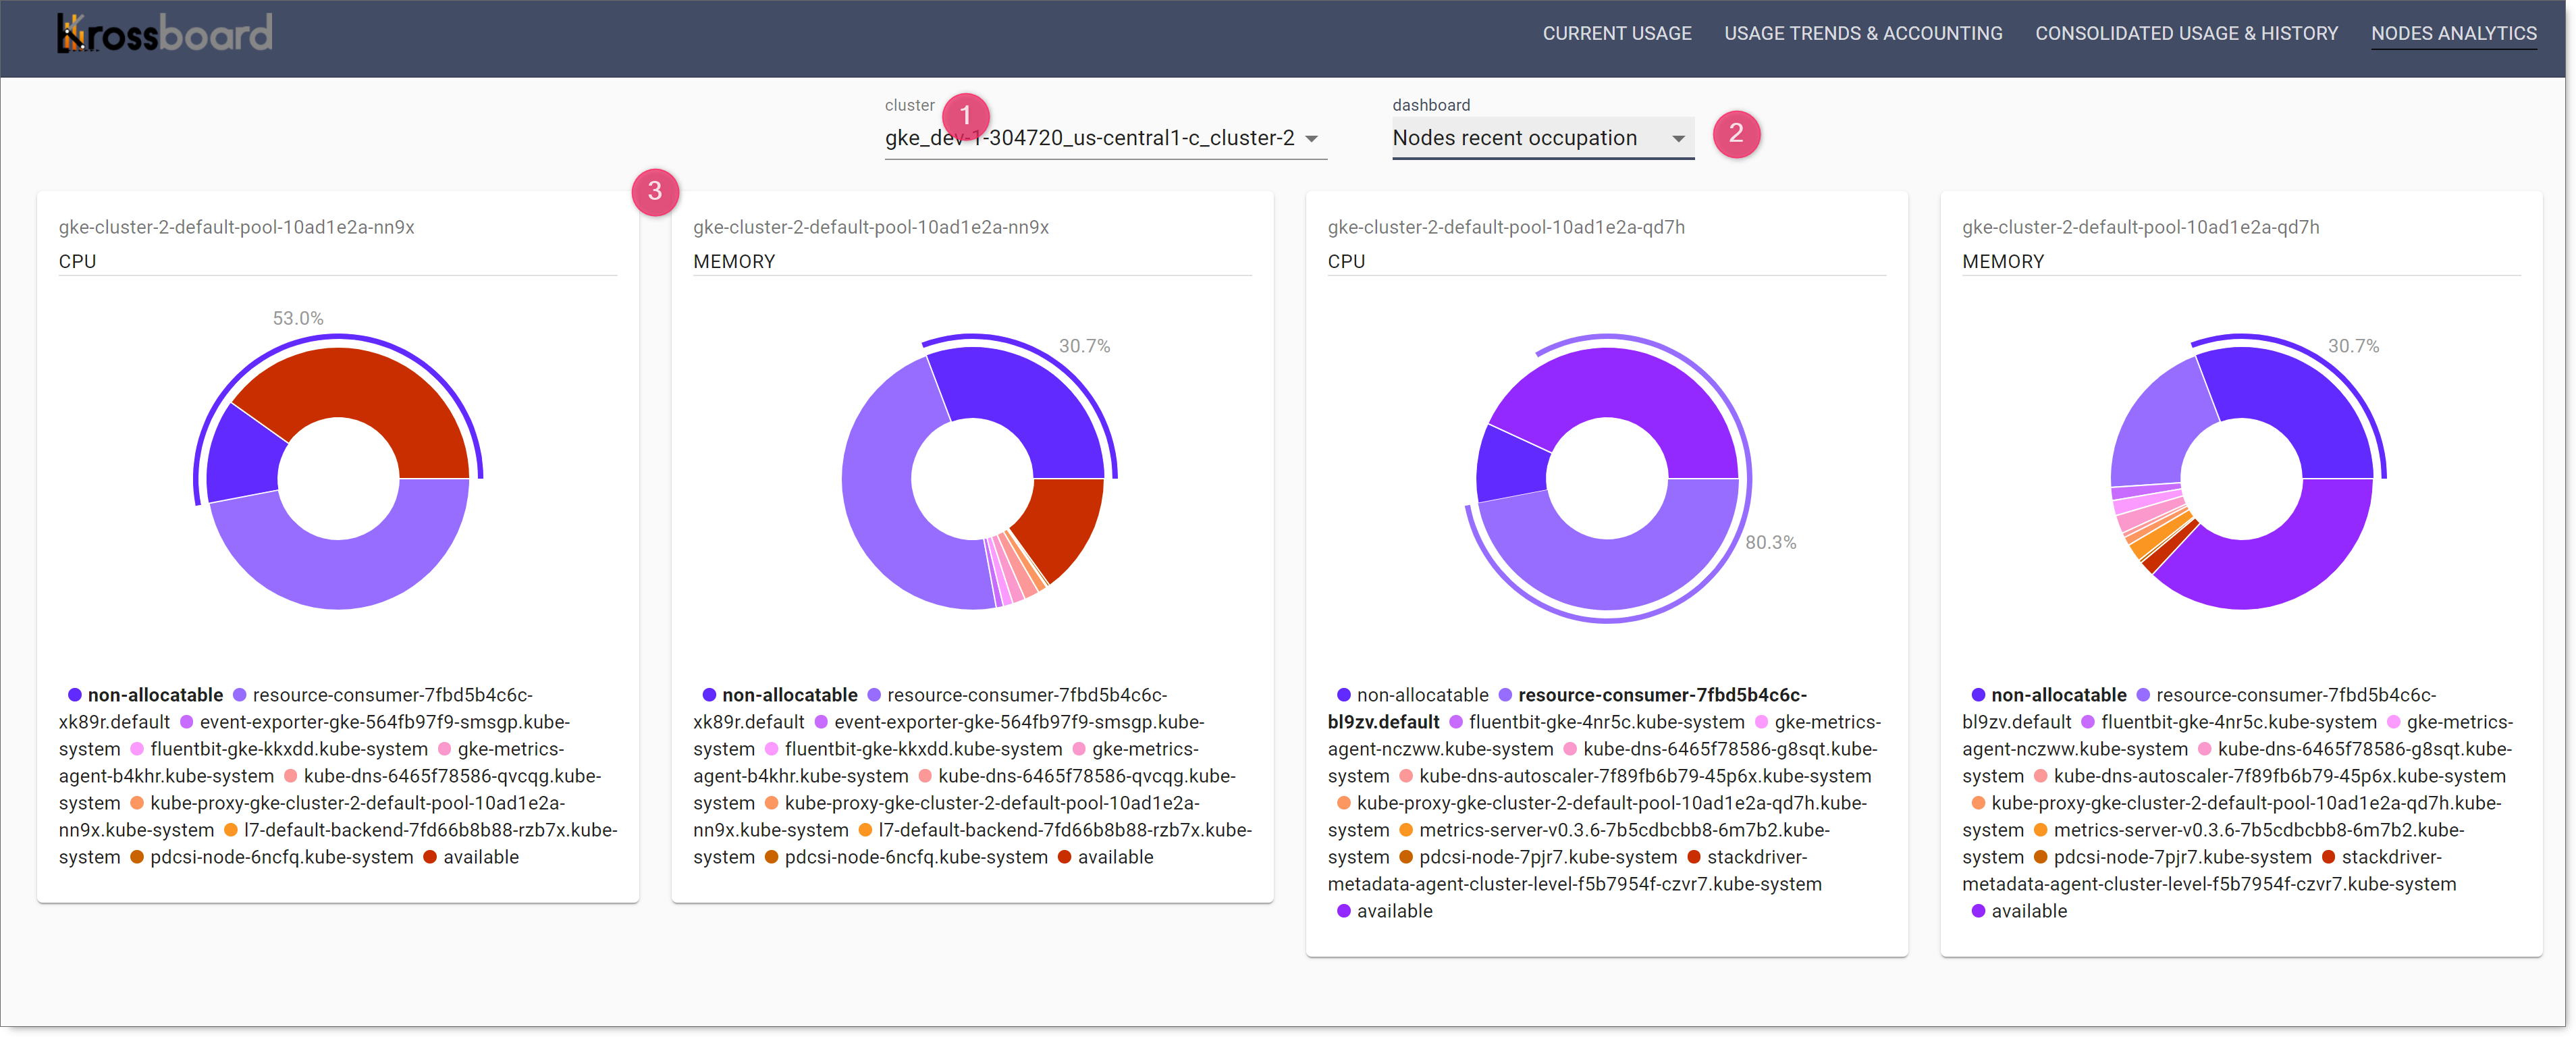
Recent Node Occupation by Pods
This dashboard is displayed by selecting a node (1) and the option Nodes recent occupation (2).
For the selected node, the analytics render a piechart report for CPU and memory consumption (3).
On each report piechart we have:
- The ratio of resources used by the different running pods.
- The ratio of available resources.
- The ratio of
non-allocatablecapacity.
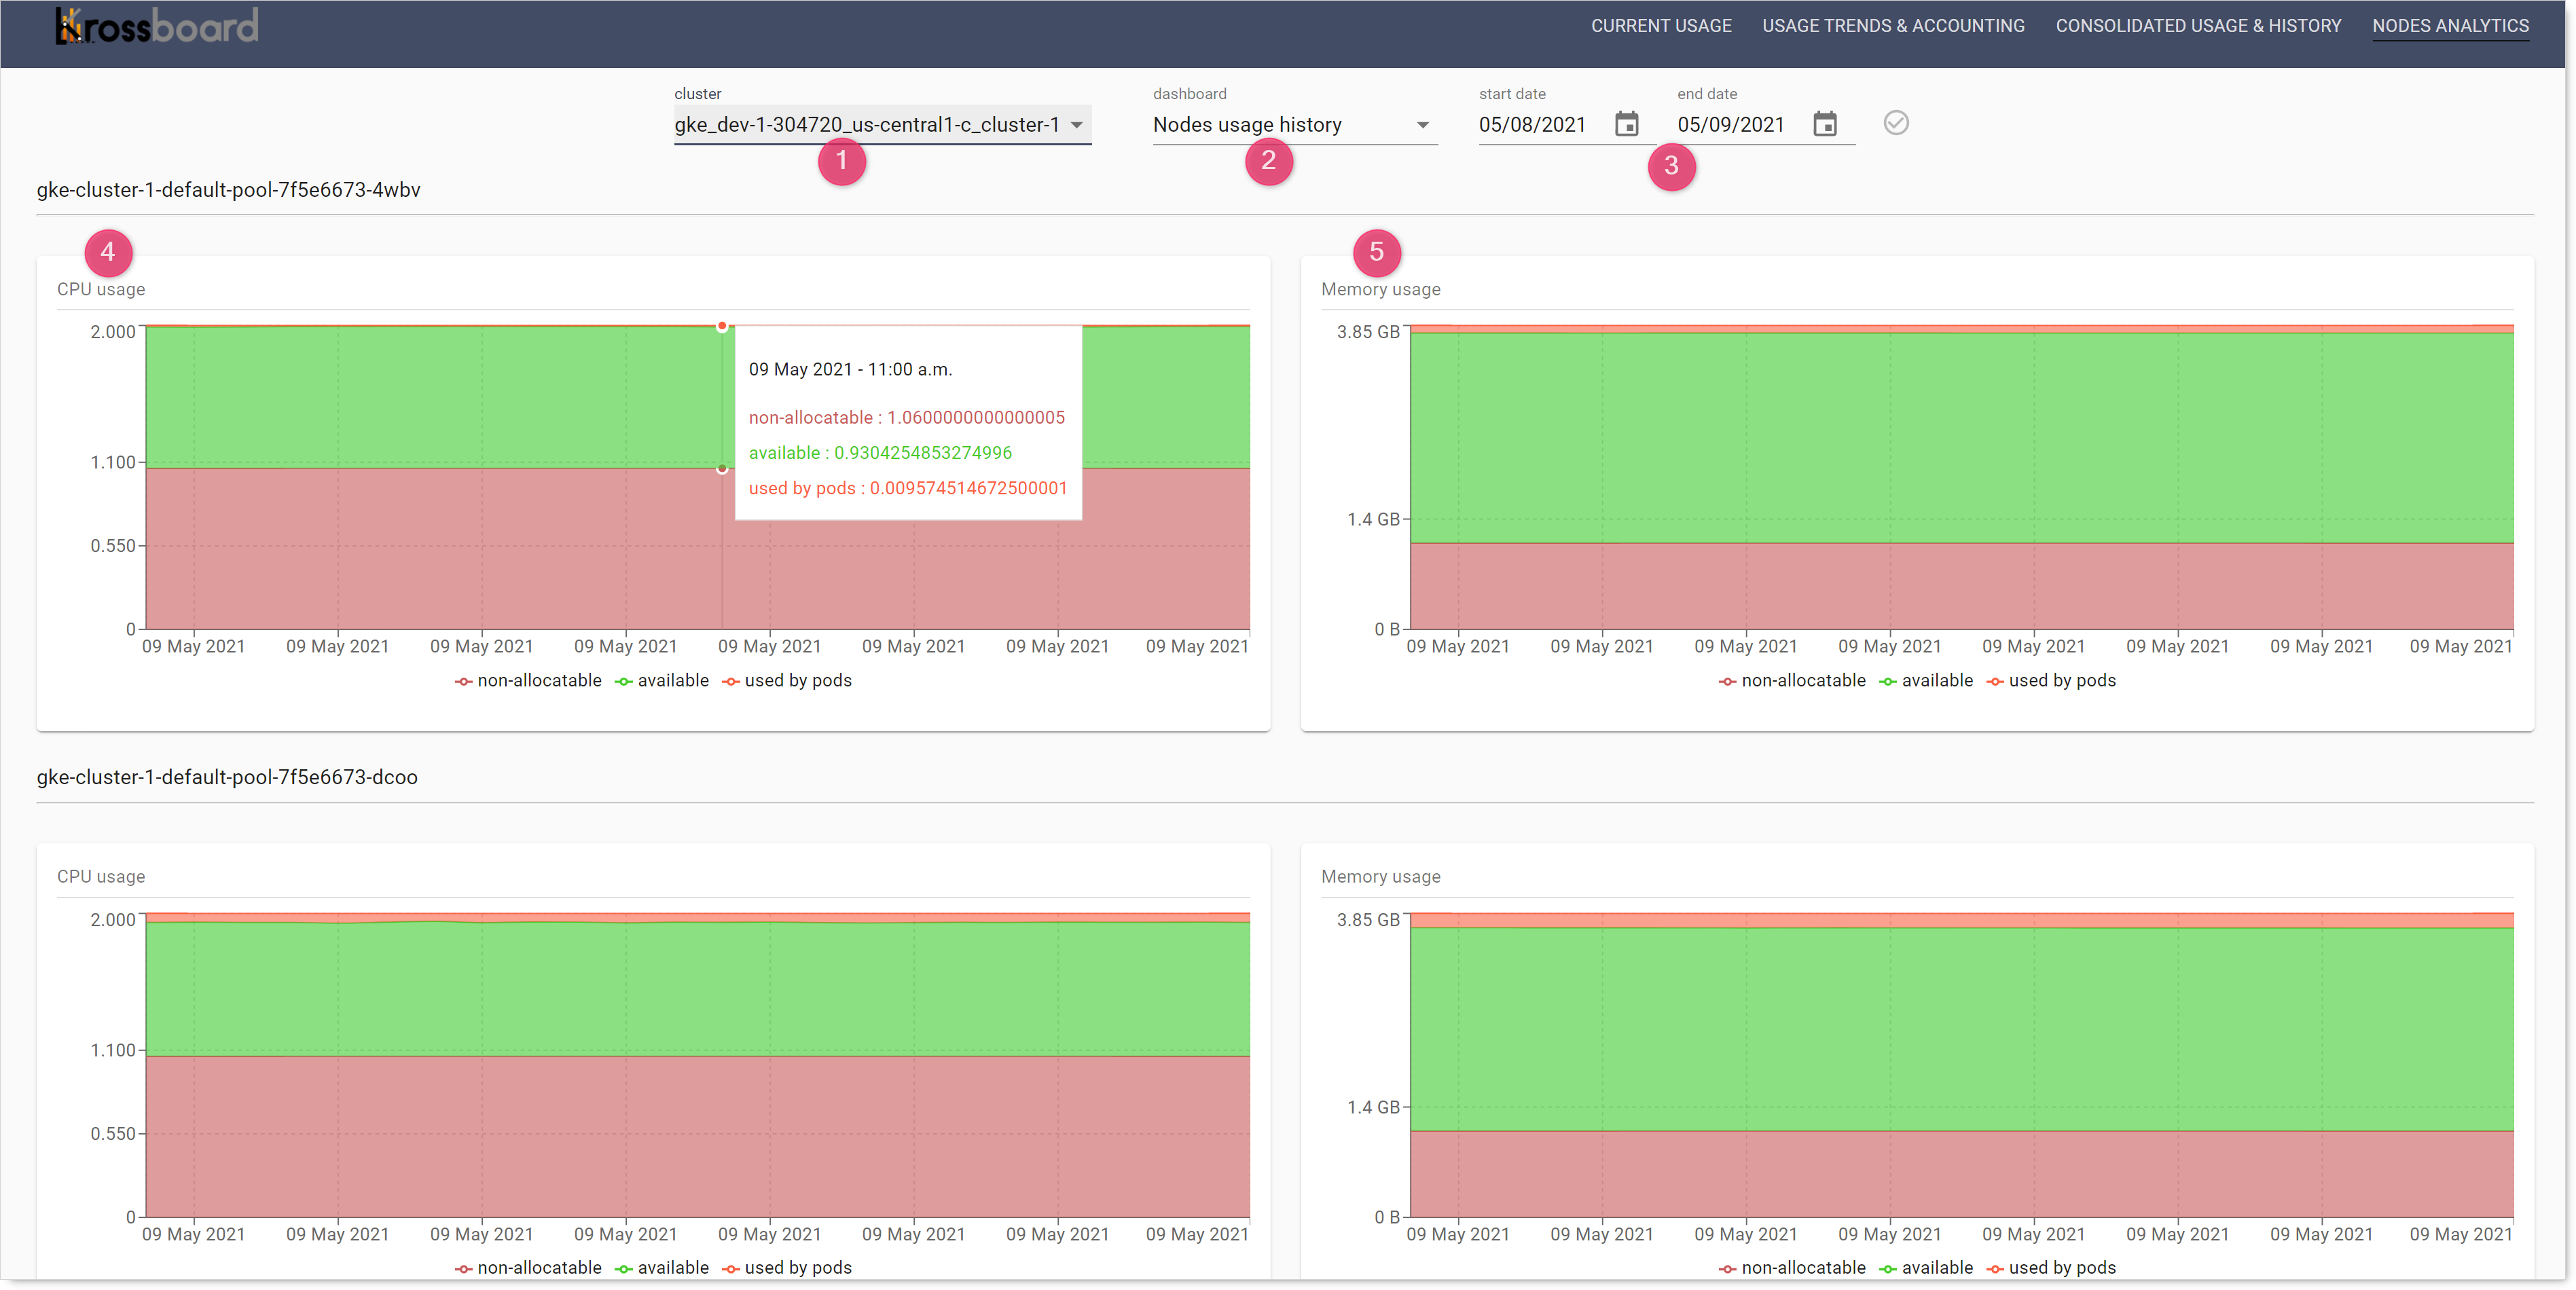
Usage History
This dashboard is enabled by selecting a cluster (1) and a user-defined period of time (default is the last 24 hours).
For each node, we have a chart for CPU (4) and memory (5) resources rendered as a stacked-areas chart.
Each chart displays and helps understand the following metrics hourly-consolidated over time (i.e. as historical trends):
- Overall capacity enabled by the node.
- Capacity consumed by pods.
- Available/free capacity.
- Non-allocatable capacity.