Krossboard - Concepts
Krossboard is meant to help organizations owning many Kubernetes clusters to easily tackle usage accounting so to take cost allocation and capacity planning decisions with factual insights.
To this end, Krossboard provides an original centralized resource usage analytics system for multiple Kubernetes. Designed to work with any Kubernetes distributions, it’s actively tested against Amazon EKS, Google GKE, Azure AKS, Red Hat OpenShift, Rancher RKE, and various vanilla Kubernetes.
When deployed on a cloud environment, Krossboard can be configured to automatically discover your managed Kubernetes on Amazon EKS, Google GKE and Microsoft AKS and track their usage over time.
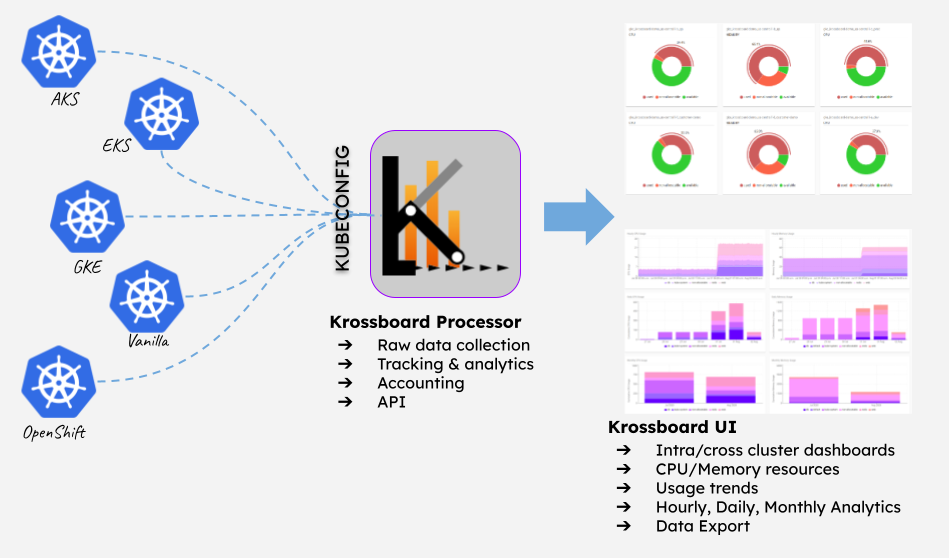
The next diagram illustrates the operating flow of Krossboard, the subsequent sections describe its key features and its benefits for organizations.
Key features
The design of Krossboard allows it to enable the following key features.
- Cross-cloud and cross-distribution, with Visualization at a central place: Krossboard runs against any Kubernetes providing an unified and consistent analytics framework. This unique design along with its friendly analytics charts and reports enable organizations to set up a global strategy to understand their Kubernetes spending by tracking how resources are used by their different projects and applications.
- Deploy in minutes, for multiple clusters: Krossboard is an integrated tool easy to deploy. Released as ready-to-install virtual machine appliances, cloud images and binary packages, its deployment only needs a couple of minutes. When deployed on a cloud environment, it can be configured to automatically discover and track the usage of your managed Kubernetes instances on Amazon EKS, Google GKE and Microsoft AKS.
- Consistent Accounting, for Cost allocation and Capacity planning: Krossboard regularly collects instantaneous usage metrics, then aggregate and consolidate over time to produce short-term (hourly), mid-term (daily) and long-term (monthly) usage accouting covering up to a year. At any point or period of time, your organization can get relevant accounting insights for cost allocation and capacity planning.
- User-extensible analytics: Aware that organizations may need specific analytics that are not natively built in Krossboard, it’s designed to feature the ability to export any data its generates in CSV format. Those data can then be further processed to extract additional insights (e.g. using tools like Google BigQuery, AWS Athena, Azure Synapse, Tableau, Microsoft Excel, to list a few).
Unique benefits
Thanks to its features and key concepts introduced above, Krossboard aims to enable unique benefits for organizations.
- Ease cost allocation decisions: Krossboard provides detailed usage accounting reports on resources consumed by each project/application during various accounting periods (hourly, daily, monthly), thereby helping organizations to share infrastructure and operations costs among their projects and/or business units.
- Help anticipate costs: Thanks to its dynamic analytics reports that show how resources are being consumed over time, Krossboard helps organizations to forecast scaling up/down, and are hence able to anticipate costs.
- Enabler for cloud-cost reduction strategy: By giving factual insights that show how the clusters of your organization are utilized over time, Krossboard helps make clusters consolidation decisions. Insights it provides can be used to motivate and drive consolidation decisions for clusters that are used in a non-efficient way, leading to reducing infrastructure and operations costs.
Established analytics paradigms
With its foundation in kube-opex-analytics (Open Source tool already adopted by an established community), Krossboard incorporates the main analytics principles of kube-opex-analytics at its core. Leveraging in addition our depth and breadth experience developing and managing applications on Kubernetes, Krossboard enables further capabilities that make it unique and effective for environments with multiple Kubernetes clusters.
- Namespace-focused: Means that consolidated resource usage metrics consider individual namespaces as fundamental units for resource sharing. A special care is taken to also account and highlight non-allocatable resources.
- Hourly Usage & Trends: Like on public clouds, resource use for each namespace is consolidated on a hourly basis. This actually corresponds to the ratio (%) of resource used per namespace during each hour. We think that this is a relevant foundation for cost calculation and capacity planning for Kubernetes resources.
- Daily and Monthly Usage: This provides for each, period (daily/monthly), namespace, and resource type (CPU/memory), consolidated cost indicators. These indicators are computed as accumulated hourly usage over that period of time.
Getting Started
Consider one of the following resources to deploy Krossboard for your Kubernetes clusters.